
About
Nowadays investing is made easy for the masses. Every online bank account offers you access to the stock market at very low transaction costs. At the same time investment recommendations and tips can be found in all media channels. This makes it difficult for the average investor to discern an honest recommendation from a bogus one. The best investment advice derives from an independent objective person that has no bias towards either direction. This best-fit for this description is an automated computer algorithm that gives you suggestions based on methods and analysis that replicates a manual analysis by an independent researcher. When you are looking for an automated computer algorithm based source of information you will have trouble finding one, since most systems like these are proprietary and get offered at monthly subscription costs, or alternatively are offered as an investment vehicle in return for your cash. This counterparty risk is obviously a disadvantage and on top you normally have to split the profits with the company running this system.
“Why can’t you just simply give me notice when you would buy or sell stock X, then i will just replicate what your system or trader is doing?”
anonymous
We obviously dont want to risk our capital and also don’t really like sharing the profits with the company selling the system. This is why we need an automated system generating impartial investment advice.
A profitable trading methodology has to give you an indication on when to Buy and when to Sell. Having a one sided bias is not going to be profitable in the long run. We also want macro advice on the global market, together with a number of indicators or signals that generate investment suggestions on a daily basis. Then we are free to decide if we want to enter into the trade or not and have a constant guide on when to cut the trade or not.
With TradeFlags we want to attempt to build this system for the public. Making trade recommendations public on purpose. Making the methods used by successful hedge funds and investment banks available to the masses and providing a notification based system that gives everyone the same signals at the same time.
Here is an example of a Buy recomendation for Facebook stock, FB, from the 30th of March 2018.
TD BUY $FB at 159.79, Supp 152.22 Resis 185.09 R22 HiLo 37% T1Y 222 buy 1.8 PE …
The abbreviated code stands for a Demark Buy of FB at 159.79USD with a Support at 152.22 and Resistence at 185.09 with a range of 22%, HiLo 37% means its 37% between the 52week Low and High. T1Y 222 is the average Analyst 1-Year Target Price for Facebook, 222 USD, with a ‘buy’ rating and a mark of 1.8 in a range of 1 to 5. PE gives the fwd Price/Earnings Ratio.
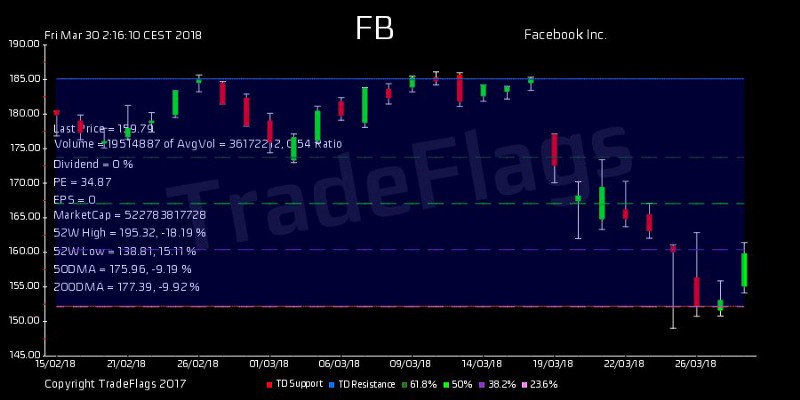
Demark Buy Facebook (FB) from 30th of March 2018
When analysing the signals over time it is interesting to look at the daily distribution of signals. Here is a time series of the Net Buy/Sells of the Demark signals over time. It shows 198 Buy Signals with an almost 8 Sigma standard deviation from the mean on the 9th of February 2018. This spot is remarably different to any other day on the chart. It suggests that this day was a particular good day to buy stocks. As it turns out comparing this to charts of the S&P 500 and others, this was true! Below is a Demark B/S Index chart of the time series generated on the 31st of May 2018.
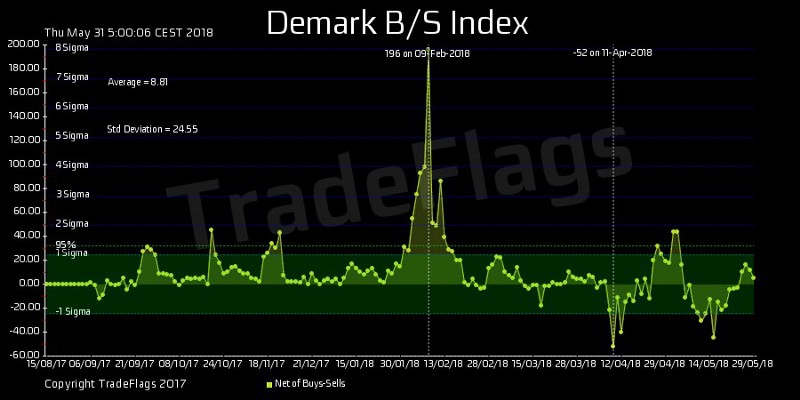
Net Buy/Sell of Demark Signals over time