The Hindenburg Omen
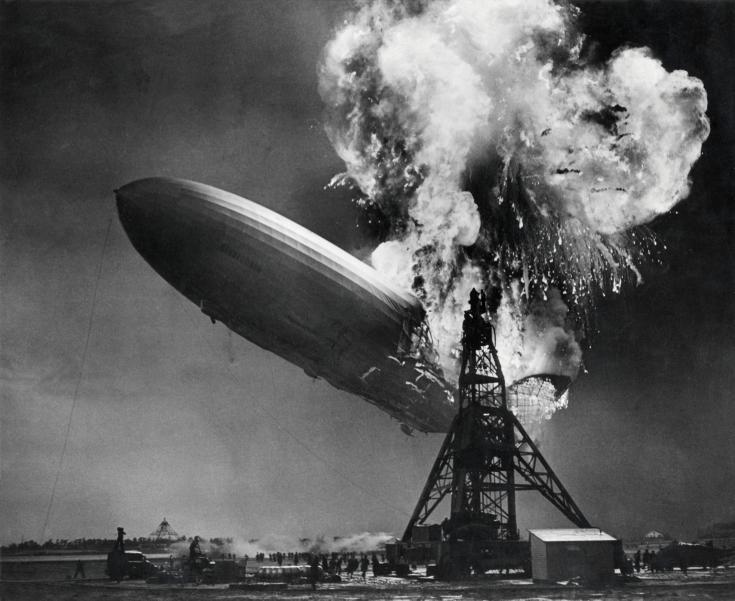
The Hindenburg Omen was created in the 80s by Jim Miekka (born 1960), a high-school physics teacher with no prior experience in trading. He came up with this indicator listening to market radio after losing his eyesight following a botched operation on his eyes which he hurt in a mine explosion. He died at age 54 on the 24 Aug 2014 being hit by a SUV which ran over him and his guide dog on the sidewalk. He was pronounced dead at the scene. Interestingly he sold all his stocks in 2010 anticipating a market correction (WSJ). The name Hindenburg derives from the famous accident of a German NAZI Zeppelin called 'Hindenburg' (named after Paul von Hindenburg, president of Germany 1925-1934, who dissolved parliament and played a key role in the seizure of power by Adolf Hitler, which he handed over power to in 1933 ). It was filled with hydrogen, which caught fire and exploded at a Naval Base in New Jersey, USA, in 1937. Because of this disaster the Nazi-Germans abandoned their idea of passenger travel using Zeppelins altogether. The picture taken of the Hindenburg Disaster in 1937 is famous for featuring on Led Zeppelin's first studio album cover of 1969. It is also fair to say the annotations to this name and the history of the creation of this Omen are quite shockingly far-reaching and ominous.
The calculation of this Technical Signal is in contrast relatively easy.
It is confirmed True if all the following conditions are met:
- #AllNewHighs > 2.2% of all Stocks AND #AllNewLows > 2.2% of all Stocks
- Stockprice(Today) > Stockprice(Today-50) for all Stocks
- McClellan Oscillator < 0
- #AllNewHighs < 2 x #AllNewLows
- These conditions are met more than once in the last 37 days
One can monitor conditions 1-4 and then simply observe how many of these signals occur in the last 37 days.
The Hindenburg Omen is an indicator for a strong correction in the stock market. It predicted the crash of 1987 and was also featured many times before the crash in 2008. Its statistical accuracy works out only to around 25% if the population of stocks is restricted to the S&P500 and DJIA, which it historically been in the past. We believe one problem with this is though that the global stock market has transformed a lot since 1987 and was already largely different in 2008 such that it makes the signal more inaccurate if one restricts the underliers only to US market. It has been restricted to US underliers in the past simply because the foreign markets were not as liquid and big and also because the signal is largely US-centric.
It makes sense to expand the universe of underliers for 2 reasons.
- The market cap of some individual stocks outside of the US are even larger than the biggest US stock. Those stocks must be moving too if you are going to have a market correction. Its not possible for just one market to selloff without other markets globally being hit.
- The signal measures the exhaustion and divergence of the market by factoring in the New Highs of the day as well as the New Lows of the day. The more underliers you are going to include the better accuracy you are going to get. Look at condition 2. How difficult is it going to be to satisfy condition 2 for that many names?
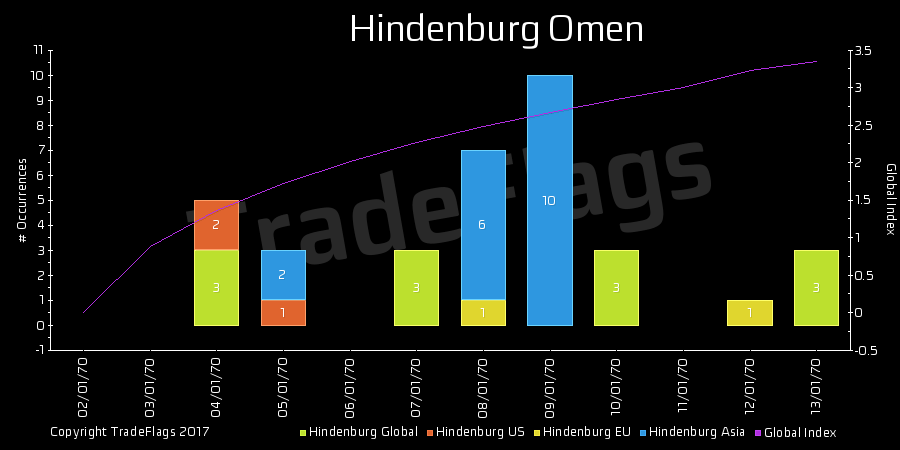
This is why in our calculation we are calculating a Hindenburg Signal for stocks in 4 Regions which are Global, Asia, Europe, US. The Hindenburg Signal for US would be corresponding to the traditionally viewed Hindenburg Omen Signal. But we think the more interesting one is the Global Hindenburg Signal.
Here is an example graph of how we are going to chart the four signals. With a stacked bar chart counting the number of occurrences of the 4 regions overlaid by a plot of a Global Index constructed from all the underliers included (the chart is purely using test data).
Links:
- http://boerse.ard.de/boersenwissen/boersenlexikon/hindenburg-omen100.html
- https://blogs.wsj.com/moneybeat/2014/08/21/jim-miekka-creator-of-hindenburg-omen-dies-in-accident/
- https://en.wikipedia.org/wiki/Hindenburg_disaster
- https://www.forbes.com/sites/lizmoyer/2010/08/23/hindenburg-omen-prompts-exit-from-stocks/#7f71311c7eac
- https://en.wikipedia.org/wiki/Hindenburg_Omen
- http://www.investopedia.com/terms/h/hindenburgomen.asp
- https://de.wikipedia.org/wiki/Paul_von_Hindenburg